Choosing the right analytics tool is crucial for understanding your app’s users and improving performance. This guide compares three popular options: Firebase Analytics, Mixpanel, and Flurry, highlighting their features, strengths, and best use cases to help you decide quickly.
Key Takeaways:
- Firebase Analytics: Free, integrates with Google services, tracks up to 500 events, and supports real-time insights. Great for startups and Google-connected apps.
- Mixpanel: Advanced user behavior analysis, retroactive funnel tracking, and A/B testing. Ideal for businesses needing detailed insights but comes with usage-based pricing.
- Flurry: Completely free, supports multiple platforms, and offers basic analytics. Best for startups or apps with simple tracking needs.
Quick Comparison Table:
| Feature | Firebase Analytics | Mixpanel | Flurry |
|---|---|---|---|
| Pricing | Free | Free (up to 100K users), Paid plans | Free |
| Event Tracking | Up to 500 events | Unlimited | Limited by segments |
| Platform Support | iOS, Android | iOS, Android, Web | iOS, Android, Blackberry, etc. |
| Real-Time Data | Yes | Yes | Yes |
| Advanced Features | Google integrations, BigQuery | Retroactive funnels, A/B testing | Basic analytics |
Recommendation: For startups, start with Firebase or Flurry for cost efficiency. For detailed user insights, upgrade to Mixpanel as your app grows.
1. Firebase Analytics Overview
Event-Based Analytics
With Firebase Analytics, developers can track up to 500 unique events and generate unlimited reports. This flexibility allows teams to monitor both standard user interactions and custom events tailored to their specific goals, making it easier to measure success and identify key conversion points [2][4].
Audience Segmentation
Firebase makes it simple to create targeted user groups by leveraging device data, custom events, user properties, and behavioral trends. These audience segments can then be used for precise feature rollouts or marketing campaigns and work seamlessly with other Firebase tools [2].
Funnel Analysis
The platform includes funnel reporting to help developers pinpoint where users drop off during key processes. It also automatically segments users affected by app crashes, offering insights into performance issues that might be impacting retention [1].
Real-Time Monitoring
Tools like StreamView and DebugView provide instant feedback on live app usage and help validate analytics data. For more advanced needs, integration with BigQuery and Data Studio allows teams to create custom reports and dashboards [4]. These features ensure developers have real-time visibility into app performance and user activity.
Pricing and Accessibility
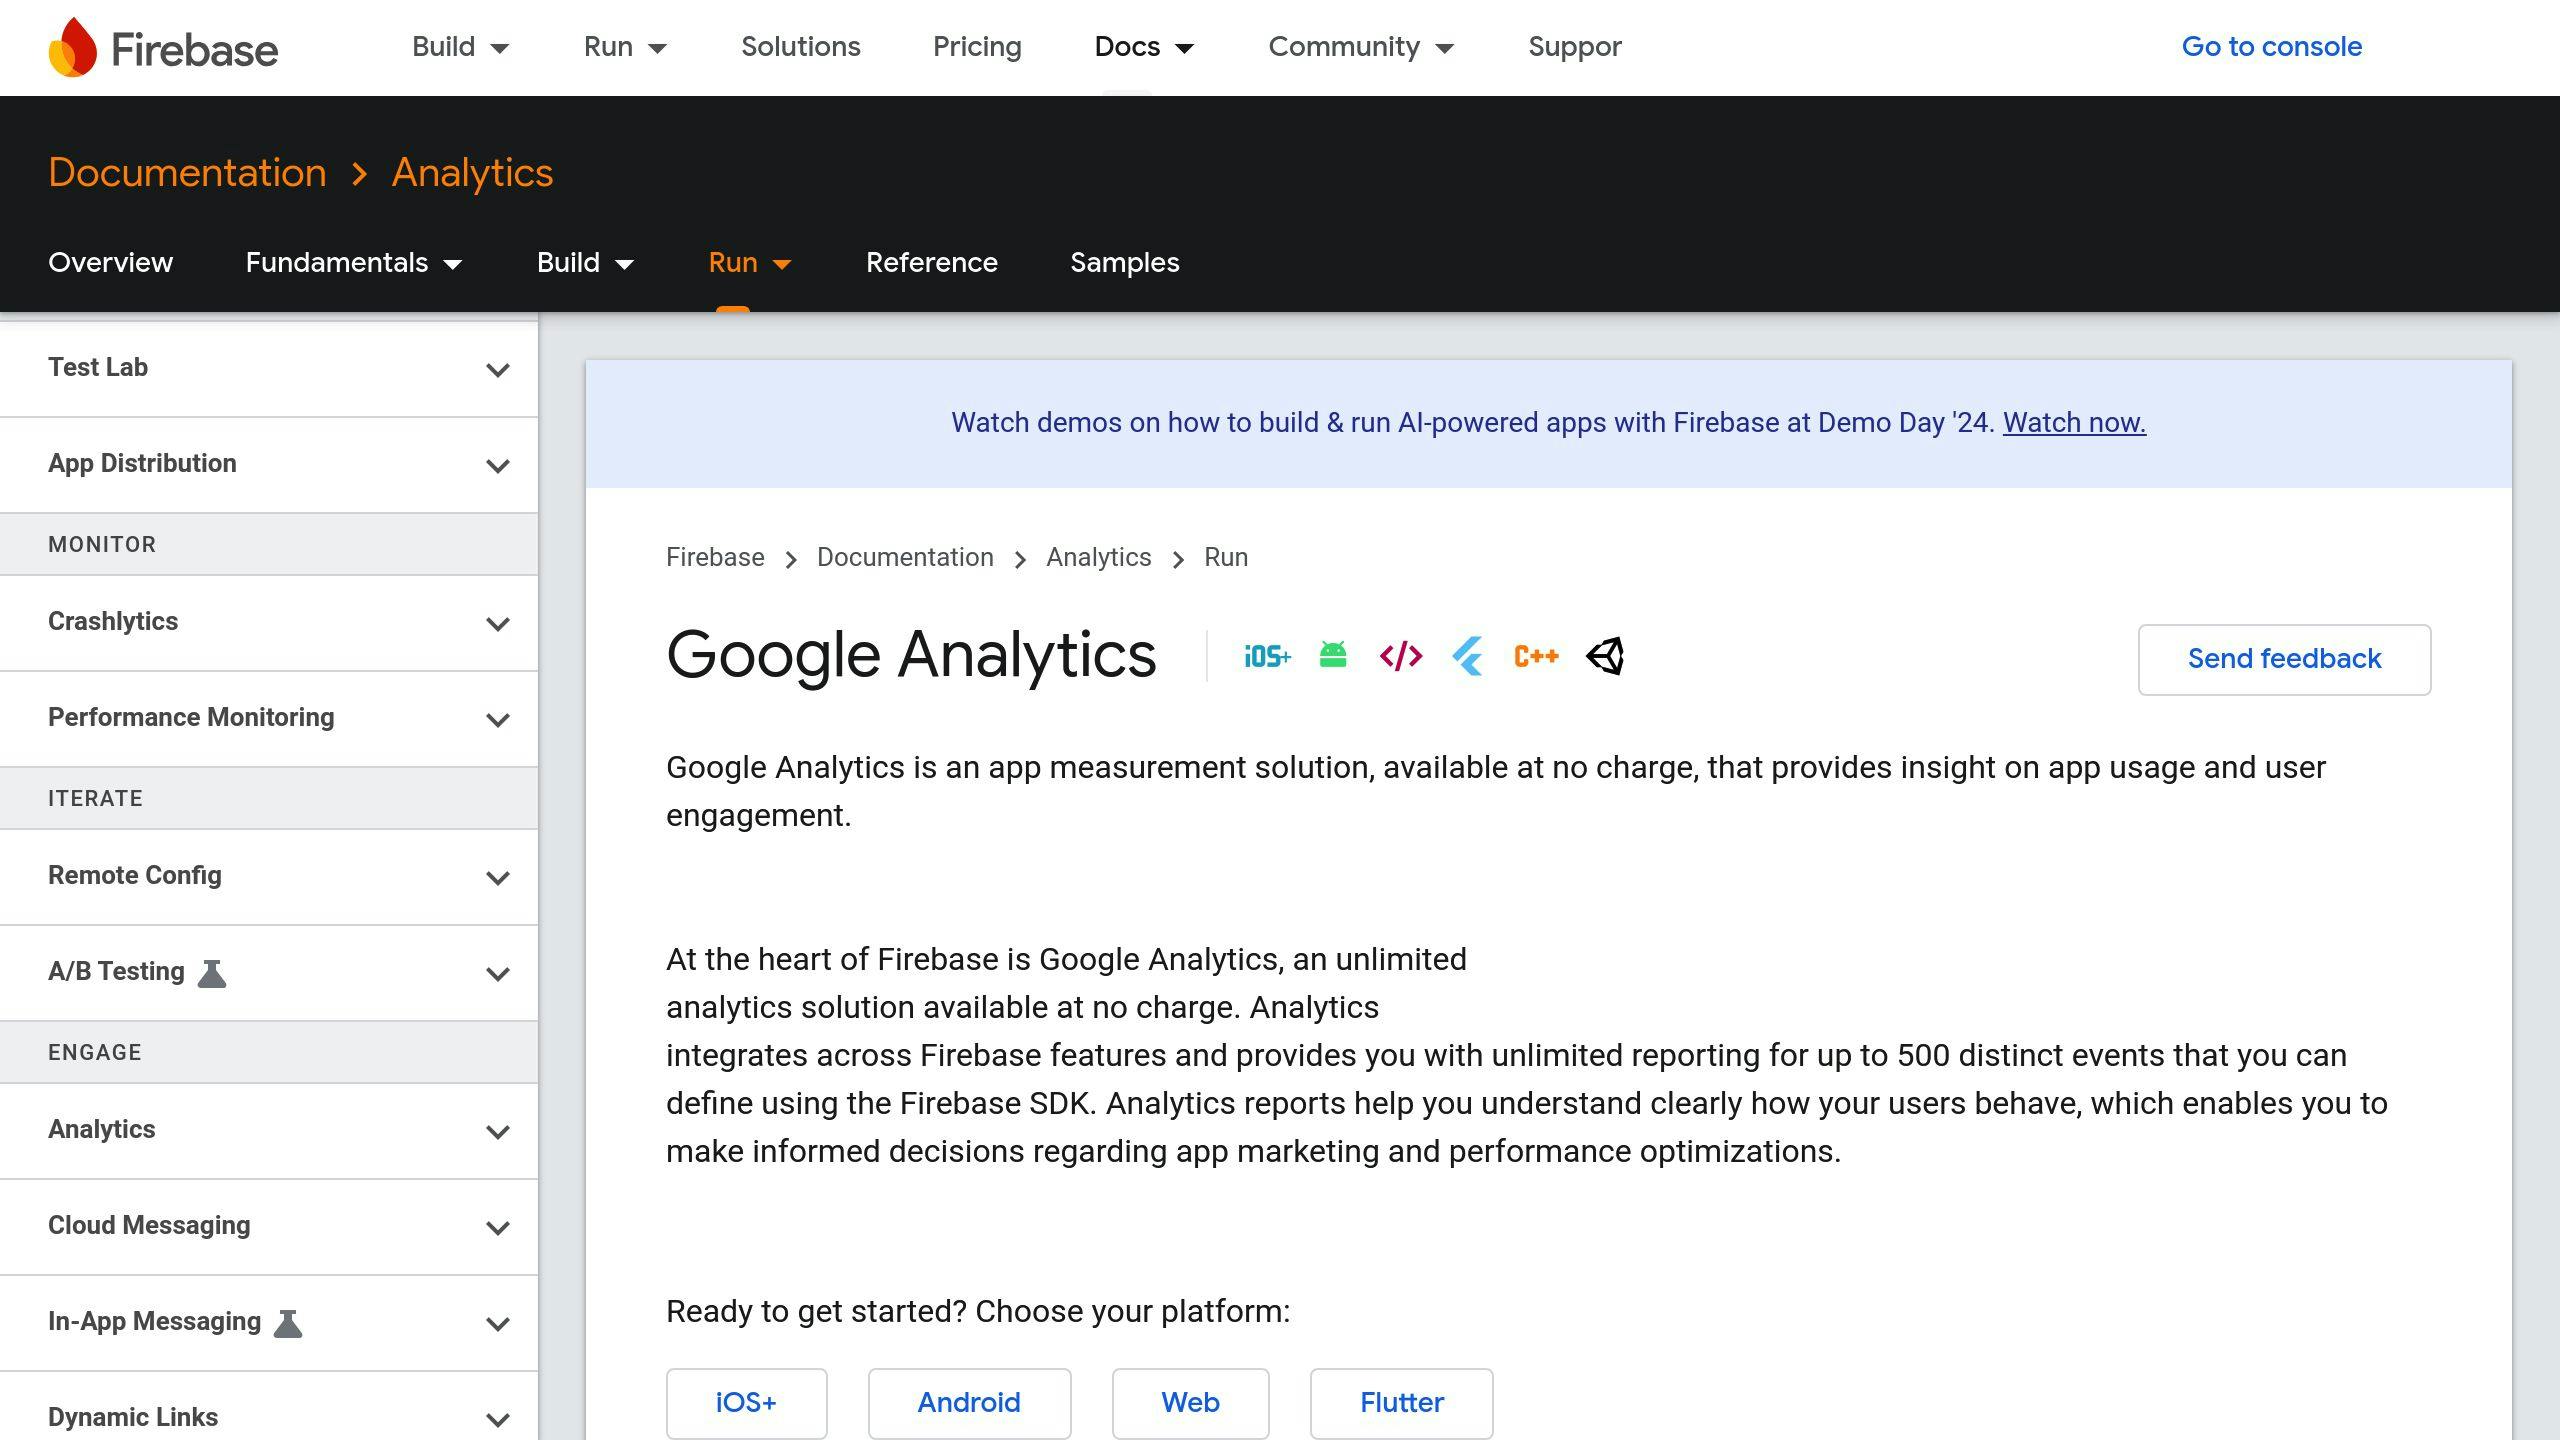
Firebase Analytics is completely free, offering features typically found in enterprise-level tools. This makes it a practical choice for businesses of all sizes looking for a powerful analytics solution without added costs [3].
Integration Capabilities
Firebase Analytics connects effortlessly with other services like Crashlytics, Remote Config, Cloud Messaging, Google Tag Manager, and Google Ads. This integration creates a cohesive ecosystem, allowing developers to monitor and respond to user behavior more effectively [2][4].
While Firebase Analytics is a cost-efficient and well-integrated choice, tools like Mixpanel stand out for their focus on in-depth user behavior analysis.
2. Mixpanel Features and Capabilities
Event-Based Analytics
Mixpanel allows developers to track specific user actions with a high level of detail. Whether it’s simple navigation or complex in-app purchases, this event tracking system provides a clear picture of user interactions.
Audience Segmentation
Mixpanel’s segmentation tools let developers create precise user groups using multiple criteria at once. These include:
- Behavioral patterns
- User attributes
- Custom event combinations
- Time-based actions
This flexibility helps teams understand and target their audience more effectively.
Funnel Analysis
Mixpanel’s retroactive funnel analysis is a standout feature. It lets teams dive into past user behavior without needing prior setup [1]. This makes it easier to uncover trends and understand how users move through conversion paths over time.
Analytics and Testing Integration
The platform includes built-in A/B testing, allowing developers to experiment with different features and track their impact on key metrics. It also integrates smoothly with CRMs, marketing tools, and data warehouses, creating a unified system for analyzing user data.
Pricing and Accessibility
Mixpanel provides a free plan for tracking up to 100,000 monthly users. For those needing more advanced tools, usage-based paid plans are available, making it a flexible option for businesses of all sizes [3].
While Mixpanel shines in detailed behavioral analysis and historical insights, Flurry offers a more budget-friendly option for tracking core metrics.
3. Flurry Tool Highlights
Event-Based Analytics
Flurry allows you to set up custom event tracking, but the process requires manual configuration and limits the number of events you can track. This makes it more suitable for straightforward tracking requirements [1].
Audience Segmentation
Flurry includes tools for creating up to 10 custom segments based on factors like demographics, user behavior, device type, and location. While useful, these basic segmentation options might not meet the needs of more advanced marketing campaigns [1].
Funnel Analysis
Flurry focuses on real-time funnel analysis, giving insights into current performance. However, it doesn’t support retroactive analysis, unlike tools like Mixpanel, which offer more robust historical data tracking [1].
Platform Compatibility
Flurry works seamlessly across multiple platforms, including iOS, Android, and some older systems. This makes it a practical option for developers managing apps on various operating systems.
Pricing and Accessibility
Flurry provides unlimited data storage and processing for free, making it appealing for startups and smaller developers. However, the trade-off is fewer advanced features and a less polished user interface compared to premium tools [3] [4].
Integration Capabilities
For basic analytics, Flurry offers essential integration features that are simple to use. This makes it a good choice for developers who need straightforward tracking without incurring additional costs [2].
Flurry’s free pricing model and broad platform support make it a solid option for basic analytics. However, its limited advanced features and integrations may not be enough for apps that demand more sophisticated analysis tools.
sbb-itb-7af2948
Flurry vs Google Analytics Comparison
Strengths and Weaknesses of Each Tool
Choosing the right analytics tool depends on understanding how each one aligns with your app’s goals and available resources. Here’s a breakdown of what each tool brings to the table.
Firebase Analytics
Firebase Analytics integrates effortlessly with Google services and includes features like automatic event logging. It also allows unlimited reporting for up to 500 distinct events, making setup and tracking straightforward [2].
On the downside, Firebase Analytics doesn’t offer much in terms of direct support. While the 500-event limit works for most apps, it might not be enough for those requiring highly detailed or complex tracking [1].
Mixpanel
Mixpanel stands out with its retroactive funnel analysis and a highly intuitive interface. These features make it a top choice for businesses that prioritize advanced analytics and flexibility [1].
However, its pricing model, which scales based on data volume, can become expensive for larger apps or businesses with high traffic [3].
Flurry
Flurry is completely free, making it a great option for startups or small-scale developers. It supports a wide range of platforms, including older ones like Blackberry, which is rare among analytics tools [1].
That said, its analytics features are more basic compared to Firebase and Mixpanel, which might limit its appeal for more complex projects.
Feature Comparison Table
Here’s a quick side-by-side look at how these tools compare across key features:
| Feature | Firebase Analytics | Mixpanel | Flurry |
|---|---|---|---|
| Pricing Model | Free with unlimited reporting | Volume-based pricing | Completely free |
| Event Tracking | Up to 500 distinct events | Unlimited | Limited by segments |
| Platform Support | iOS, Android | iOS, Android, Web | iOS, Android, Java ME, Blackberry, Windows Phone |
| Real-time Analytics | Yes | Yes | Yes |
| User Interface | Good | Excellent | Basic |
| Integration Options | Google services ecosystem | Custom APIs | Basic integration features |
Best Use Cases
Here’s when to use each tool:
- Firebase Analytics: Best for apps tightly connected to Google services, projects that need extensive event tracking, and teams comfortable managing their own analytics.
- Mixpanel: Ideal for businesses focused on detailed user behavior insights, those ready to invest in advanced analytics, and teams that benefit from retroactive data analysis.
- Flurry: A great choice for startups with tight budgets, apps needing basic analytics, or developers working on multiple platforms.
In general, Flurry is perfect for simpler needs, while Firebase and Mixpanel are better suited for apps requiring more advanced analytics, depending on your budget and project complexity [1][3][4].
Final Thoughts and Recommendations
The analytics tool you choose plays a crucial role in your app’s success by shaping the insights you gather and influencing development decisions. Here’s how you can approach the selection process based on your app’s specific needs:
For startups and small businesses, Firebase Analytics stands out for its free tier, offering detailed insights without putting pressure on tight budgets. If your needs grow, you can gradually transition to more advanced tools while keeping costs manageable.
Mid-sized apps can benefit from a combination of tools. Start with Firebase Analytics to cover essential metrics, then add features from Mixpanel as your requirements evolve. This approach keeps costs under control while expanding your analytical capabilities.
For enterprise-level apps, Mixpanel is often worth the investment. Its advanced tracking and analysis tools can deliver a solid return, especially for large-scale operations where understanding user behavior is critical [3].
Decision Framework
To simplify your choice, here’s a quick guide based on your app’s main focus:
| App Focus | Recommended Tool | Key Benefit |
|---|---|---|
| User Engagement | Mixpanel | In-depth user behavior tracking |
| Cost Efficiency | Firebase Analytics | Free and integrates with Google tools |
| Multi-Platform | Flurry | Works well with legacy systems |
| Growth Analysis | Firebase (Startups) / Mixpanel (Enterprise) | Scales with your app’s growth stage |
Maximizing the Tool’s Potential
Once you’ve picked a tool, using it effectively is just as important. Here are a few tips to get the most out of your analytics setup:
- Define specific metrics that align closely with your business goals.
- Conduct monthly audits to ensure your data stays relevant and actionable.
- Integrate complementary tools to create a seamless analytics ecosystem.
As your app grows and changes, your analytics needs will likely shift too. Many apps start with Firebase or Flurry for basic tracking, then move to Mixpanel for deeper insights as their user base and requirements expand [4].


